|
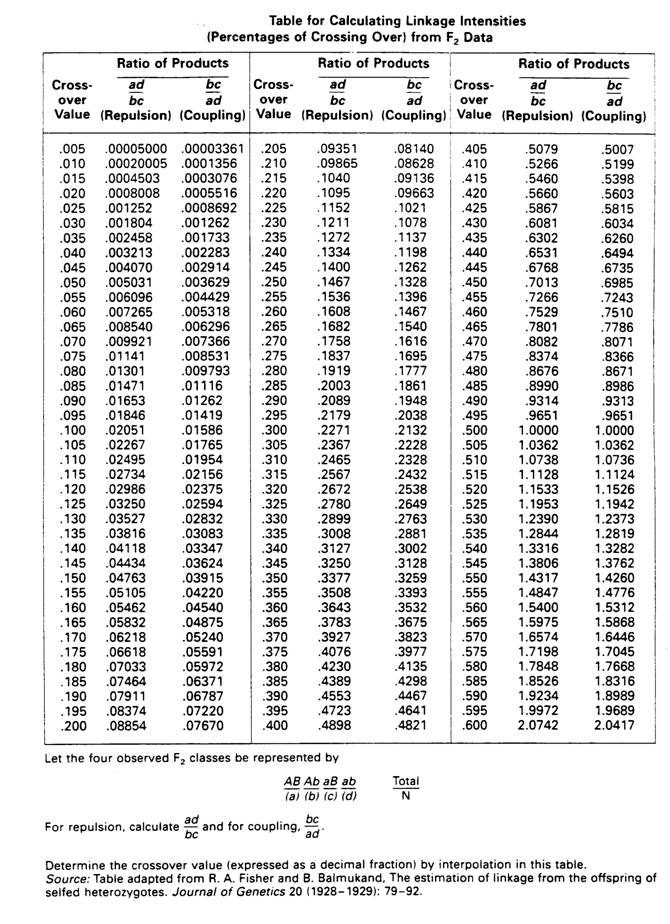
Calculation of recombination from F2 data. |
For example, the snail Biomphalaria glabrata is of great interest since it is a primary vector for the parasitic disease schistosomiasis in many tropical countries. This snail is a functional hermaphrodite and can donate sperm (act as a male), receive sperm (act as a female) or internally fertilize its own eggs.
The table below summarizes the Chi-square goodness of fit tests for the joint F2 cross, for segregation at the eye color locus, for segregation at the aristal shape locus and for independence of the eye color and shape loci. The tests all suggest that the deviation from the 9:3:3:1 ratio is due to linkage. For description of these tests Click here.
|
c2
|
Reject/Do not Reject
|
||
|
1.
|
Fits 9:3:3:1 ratio
|
480.82
|
Reject
|
|
2.
|
Fits 3:1 ratio eyes
|
.44 with 1 df
|
Do not Reject
|
|
3.
|
Fits 3:1 ratio arista
|
.067 with 1 df
|
Do not Reject
|
|
4.
|
Independence
|
421.94 with 1 df
|
Reject
|
The first step is to decide if the genes are in coupling and repulsion.
| Hint:
•If
the parental cross is unknown, you can always tell if the system
is in coupling or repulsion by looking at the frequency of the
double homozygote recessive (aabb).
•If
the system is in independent assortment the
aabb genotype (ab phenotype) has a frequency of 1/16.
•
If the system is in coupling, the aabb genotype (ab phenotype) will have a frequency greater than 1/16; if the system is in repulsion the aabb genotype (ab phenotype) will have a frequency less than 1/16. |
The phenotypic frequencies must be summarized as shown below
| G | g | |
| F | GF (a) | gF(c) |
| f | Gf (b) | gf (d) |
| G | g | |
| F | a = 1044 | c= 151 |
| f | b = 144 | d = 262 |
In our example the genes are in coupling so :
| For Repulsion the Calculation is:
ad
---------
bc
|
|
Quick Links F2 Cross |
|
| 1 | Basic F2 cross - autosomal genes |
| 2 | Basic F2 cross- X-linked gene |
| Expected Phenotypes of F2 Cross - Single Autosomal Traits | |
| Expected Phenotypes of F2 Cross - X-linked gene | |
| 4 | F2 cross - two unlinked autosomal genes |
| 5 | F2 cross - one autosomal - one X-linked gene |
| 6 | Linkage - Coupling and Repulsion |
| 7 | F2 cross - two linked autosomal genes -coupling |
| 8 | F2 cross - two linked autosomal genes - repulsion |
| 9 | Measuring the recombination rate from F2 data |
| Recombination from F2 data - Table of Values | |
| 10 | Basic F2 cross- Z-linked gene (inactive) |
| 12 | Expected Phenotypes of F2 Cross - Z-linked gene (inactive) |
| 13 | F2 cross - one autosomal - one Z-linked gene (inactive) |
|
Also See |
|
| Detection of Linkage - Basic Info - Two Autosomal Traits - Complete Dominance | |
| Detection of Linkage - More complex examples | |
| Detection of Linkage - One More Example | |
| Detection of Linkage - Two Autosomal Traits - Heterozygote has Unique Phenotype | |
| Home page | |
| Detailed List for Mendelian Genetics | |